The breakout limit strategy is an advanced twist on traditional breakout trading that solves one of the biggest problems in stock picking — false breakouts. In the previous article, we introduced a simple breakout strategy, demonstrating that a profitable strategy can be built on a straightforward concept. All it takes is a bit of creativity and testing.
Why the Breakout Limit Strategy Solves False Breakouts
The biggest challenge with breakout strategies is false breakouts — when the price crosses our Stop order level but then reverses, failing to continue in the expected direction. The breakout limit strategy avoids some of these fakeouts by only buying when the price breaks the resistance level and then makes a minor correction. At this point, we place a Limit order to buy the share.
While many of these Limit orders may go unfilled, reducing the total number of trades, this should increase the Win% rate significantly.

Price bounce from Limit order — the core idea behind the breakout limit strategy
Setting Up the Breakout Limit Strategy in AlgoCloud
Let’s revisit the strategy we developed last time. This time, however, we won’t buy immediately when the price breaks through resistance. Instead, we’ll place a Limit order at 2% below the broken resistance level.
First, we’ll make a few changes. Rather than entering at the Market price at the end of the day, we’ll calculate and place a Limit order before the market opens. Therefore, we need to change the input trigger to BeforeBarOpen.

Finally, we need to update the input condition and order type. We’ll only place an entry order if a breakout has occurred within the past 10 days:
HighestClose(C, 10) > HighestHigh(H, 200)
During these 10 days, the entry price will be calculated as the highest Close minus 2%:
HighestClose(C, 10) – 2%
Here is the breakout limit strategy entry setup in AlgoCloud:

Today, I won’t test all the variations of the original strategies from the previous article. Instead, we’ll focus on testing variants 01 and 03 as a representative sample.
Breakout Limit Strategy Variant 01 — StopLoss and ProfitTarget
We’ll execute the same setup as in the original breakout strategy variant 01:
- ProfitTarget 15%
- StopLoss 10%

Compared to the original strategy, the profit fell by half, but the number of trades decreased by nearly 80%. This means the profit per trade has increased significantly, with other metrics also showing improvement. For instance, the drawdown dropped by almost half compared to the original strategy.
This demonstrates that with the breakout limit strategy, fewer trades can lead to better results.
| Strategy type | Variant | # trades | Total Profit | CAGR | Profit Factor | Ret/DD | Win % | DD % |
| Breakout | VAR 1 | 1406 | $44,705 | 3.2 | 1.29 | 5.91 | 46.19 | 37.47 |
| Breakout Limit | VAR 1 | 334 | $21,183 | 2.13 | 1.67 | 8.35 | 51.5 | 19.98 |
Comparison of breakout limit strategy vs original — variant 01
Breakout Limit Strategy Variant 03A — Consecutive Close Exit
Now, let’s examine the results with the breakout limit strategy using the exit conditions from variant 03 of the original strategy. We’ll exit based on the condition that the Close price has been greater than the previous day’s for 5 consecutive days:
- when Close[0] > Close[1] is true 5 bars

Compared to the original strategy, %Drawdown has increased slightly. However, we have half the trades, and the profit is almost identical. Even better, all other indicators have significantly improved — the Profit Factor is 2.01, and Win% is over 64%, which is excellent.
Breakout Limit Strategy Variant 03B — Volatility-Based Entry
Finally, we’ll test the same breakout limit strategy but this time using volatility-based entry rather than a percentage-based Limit order. Here, we set the Limit order at:
HighestClose(C, 10) – 1.5 * ATR(5)

The exit remains the same as in the previous version.
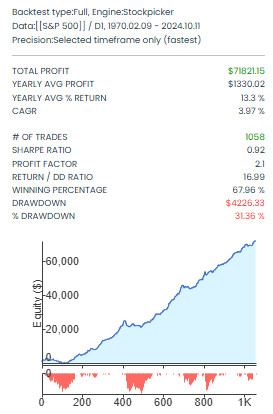
In this last example, the %Drawdown increased slightly, and profit decreased, but the number of trades is again smaller, and the other indicators have continued to improve. The equity curve is much smoother as a result.
| Strategy type | Variant | # trades | Total Profit | CAGR | Profit Factor | Ret/DD | Win % | DD % |
| Breakout | VAR 3 | 3188 | $81,523 | 4.19 | 1.66 | 15.39 | 57.51 | 20.44 |
| Breakout Limit | VAR 3A | 1589 | $83,767 | 4.23 | 2.01 | 15.97 | 64.19 | 27.71 |
| Breakout Limit | VAR 3B | 1058 | $71,821 | 3.97 | 2.10 | 16.99 | 67.96 | 31.36 |
Comparison of all breakout limit strategy variant 03 results
Conclusion: Is the Breakout Limit Strategy Worth It?
In today’s article, I wanted to show an alternative approach to trading breakout strategies that minimizes “fakeouts,” reduces the number of trades and commission costs, and increases the success rate. The breakout limit strategy consistently delivered higher Profit Factors and Win% across all variants.
In some cases, Drawdown has increased slightly because we haven’t yet applied a simple filter to remove non-trending trades. In trading, there’s always a trade-off.
This is another valuable piece in our trading portfolio puzzle. Next time, we’ll introduce another method for trading stocks — the buying dips strategy — including drawdown filters, and update our portfolio.
Related Articles
- A Simple Breakout Strategy: Detailed Analysis
- Russell 1000: Buying Dips Strategy
- Building the First Portfolio
Libor Štěpán