The great thing about AlgoCloud is that you don’t need to know how to program. All codes can be written in a simple way that even a complete beginner can understand. Today, I’m going to show you how to create a mini portfolio with just one simple condition.
Breakout strategies are one of the basic strategies used in trading. The logic of such a strategy is that the price moves for some time within a certain channel or under strong resistance. Once the price breaks this resistance or channel, it is speculated that the movement will be quite strong for some time.
Sample breakout strategy on the MSFT market
The entry point for such a strategy will be when the closing price crosses the highest high of the last 200 days:
Close > HighestHigh(H, 200)
We will enter at the closing price before the stock market closes at the market price. So we set the entry trigger to OnBarClose.
Since we will be entering after the close of the current day, we must set the Shift value to 0 (Close[0]). We calculate the highest high using the function (MAX) for the highest value over a specified period.
We will trade the strategy on index shares of the S&P 500, which consists of 500 shares. We will set the maximum number of open positions to 5 and filter them based on the evaluation using the ROC function.
We will try 4 output variants:
Variant 01
StopLoss 10%
ProfitTarget 15%
The backtest shows that the price breakout idea has its edge and the strategy is profitable, with a total profit of more than $44,000. Other parameters also look promising (profit factor, RET/DD, Win%, %Drawdown).
Variant 02
ProfitTarget 15%
ExitAfterXBars 20
In the next variant, we will keep the ProfitTarget and instead of the StopLoss, we will implement an exit after 20 bars. This means that if the price does not reach the ProfitTarget within 20 days, the position will be automatically closed after 20 days.
The second variant shows improvements in all metrics. The equity curve is smoother, and the total profit has increased. The ProfitFactor and RET/DD are also higher. The percentage of successful trades has jumped over 50%, and the Drawdown has fallen by almost 10%. A much better result.
Variant 03
when Close[0] > Close[1] is true 5 bars
For Variant 03, we will drop the StopLoss and ProfitTarget completely. We will let the strategy run until the condition that the current Close is higher than the previous Close is fulfilled, a total of 5 times in a row. Since we can calculate the risk in advance with stocks, we don’t need to set a StopLoss and can let the strategy run freely to see what it can do.
As you can see, even without a StopLoss and ProfitTarget, the strategy is profitable. Moreover, the equity curve is even smoother than in the previous case, and all other metrics have also improved. The %Drawdown dropped another 7%, which is great.
Variant 04
For the last variant, we will keep the exit condition the same as for the previous variant, with the only change being an increase in the maximum number of open positions from 5 to 10.
Here, you can see that even a small change can improve the strategy. Although we doubled the number of trades by doubling positions, this allowed us to spread the risk over more markets, slightly improving our Win% while mainly reducing the %Drawdown by another 7%.
Using this example, I wanted to show that creating a simple, profitable strategy is not that complicated. You don’t have to come up with complex codes, just one simple condition. Of course, you can improve your strategy with some filters based on price, volume or position score.
Metrics of individual strategies and the overall portfolio
As you can see, even this basic idea of the breakout strategy can be improved by trying different exit variants. Even with these small changes, we have effectively created 4 separate strategies that are not correlated with each other, except for variants 03 and 04, which are identical except for the number of positions. The correlation is much higher for these two variants.
Mutual correlation of individual variants
We took a simple condition, tried 3 different types of exits, changed the maximum number of positions once, and created a mini-portfolio that you can start trading with a clear conscience.
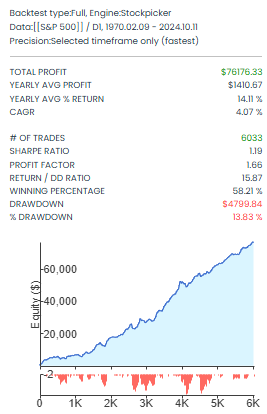
Portfolio equity
Comparison of equity curves of individual variants
I started like that too. I took the basic idea of the strategy, visualized it on a chart, and looked for ways to get the most out of it. I wrote simple code and tried different variations of outputs that made sense.
You can clone and right away start testing all strategies mentioned in the article here:
To provide the best experiences, we use technologies like cookies to store and/or access device information. Consenting to these technologies will allow us to process data such as browsing behavior or unique IDs on this site. Not consenting or withdrawing consent, may adversely affect certain features and functions.
Functional
Always active
The technical storage or access is strictly necessary for the legitimate purpose of enabling the use of a specific service explicitly requested by the subscriber or user, or for the sole purpose of carrying out the transmission of a communication over an electronic communications network.
Preferences
The technical storage or access is necessary for the legitimate purpose of storing preferences that are not requested by the subscriber or user.
Statistics
The technical storage or access that is used exclusively for statistical purposes.The technical storage or access that is used exclusively for anonymous statistical purposes. Without a subpoena, voluntary compliance on the part of your Internet Service Provider, or additional records from a third party, information stored or retrieved for this purpose alone cannot usually be used to identify you.
Marketing
The technical storage or access is required to create user profiles to send advertising, or to track the user on a website or across several websites for similar marketing purposes.